
After you hit "F5" (run in debug mode) and get the website running, go the page in question that should be running your javascript. Go back to Visual Studio > Solution Explorer > Script Documents > Windows Internet Explorer you will see all the scripts that are currently running.

In that section, if you scroll down you should either see the name of the page or default followed by some text (ie: default?dzHbakj3kj09d0dflkjb_lk2j3jlkj)

Open the file and place your breakpoint(s). Allowing you to do quickwatch or to view the data.

Some additional methods on stepping through and debugging Javascript:

In that section, if you scroll down you should either see the name of the page or default followed by some text (ie: default?dzHbakj3kj09d0dflkjb_lk2j3jlkj)
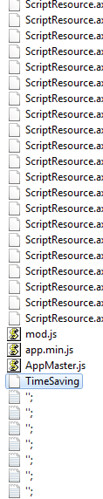
Open the file and place your breakpoint(s). Allowing you to do quickwatch or to view the data.

Some additional methods on stepping through and debugging Javascript:
- If you have VS2012 there is the DOM Explorer: http://msdn.microsoft.com/en-us/library/windows/apps/hh441474.aspx
- Using the "debugger" keyword in javascript (http://www.aspsnippets.com/Articles/Debug-JavaScript-and-jQuery-using-Visual-Studio-in-Internet-Explorer-browser.aspx)
JavaScript has adebuggerkeyword which can appear in JavaScript source. Older JavaScript engines will flag its use as a syntax error (use of a reserved word). But newer engines will allow the keyword. Engine embedders can install a callback hook to be called if and when the keyword is reached during script execution. At some future point there may be a JavaScript Debugger which will install such a hook and pop up a fully featured debugging window when this event fires. For now I have created such a hook in xpconnect which is set in DEBUG builds only. If thedebuggerkeyword is reached then the JavaScript stack will be dumped to the native console (same as ifDumpJSStack()had been called.
After hitting thedebuggerkeword and dumping the JS call stack, JS execution will continue as if nothing unusual had happened. If you would like this to stop in your native debugger then set a breakpoint inxpc_DebuggerKeywordHandlerin your native debugger. Thedebuggerstatement can be very useful as a kind of superdumpas you develop your JavaScript code. You can also use it as a kind of assert:if(some_unusual_condition) debugger;
Note 1) in the example above the test will always happen even thoughdebuggermight have no effect in non-DEBUG builds 2) at some future point someone is bound to ship a JavaScript Debugger that will catch these cases (even in non-DEBUG builds). When that happens, users trying to debug their own JS code might trip over yourdebuggerstatements. So, while thesedebuggerstatements might be very useful as you write code, you may not want to leave them in permanently.
- Mozilla http://www-archive.mozilla.org/scriptable/javascript-stack-dumper.html

