
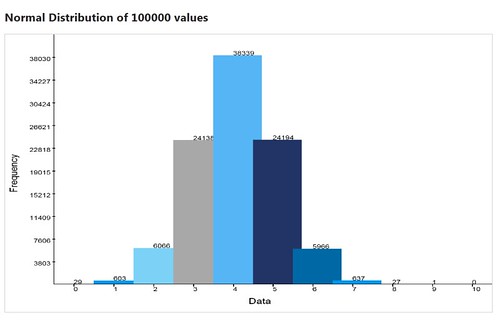
Code Snippet
- <!DOCTYPE html>
- <html>
- <head>
- <meta charset="utf-8" />
- <meta name="viewport" content="width=device-width" />
- <title>Normal Distribution</title>
- <link href="/Content/site.css" rel="stylesheet"/>
- <script src="/Scripts/modernizr-2.5.3.js"></script>
- <script src="/Scripts/jquery-1.7.1.js"></script>
- </head>
- <body>
- <h2 id="header" class="header">Normal Distribution</h2>
- <canvas id="myCanvas" width="1600px" height="1200px" style="border: 1px solid #d3d3d3;">Your browser does not support the HTML5 canvas tag.
- </canvas>
- <script type="text/javascript">
- function Point(X, Y) {this.X = X;this.Y = Y;};
- function resizeFrame() {var h = $(window).height();var w = $(window).width();$("#myCanvas").css('height', h - 100); $("#myCanvas").css('width', w - 50);}
- function canvas() {this.height = $(window).height();this.width = $(window).width();}
- $(document).ready(function () {
- jQuery.event.add(window, "load", resizeFrame);
- jQuery.event.add(window, "resize", resizeFrame);
- });
- var min,max,headSpace;
- var size = 100000;
- var density = [];
- var dcount = 0;
- var normalValues = [];
- var dmin = 9007199254740992;
- var dmax = 0;
- var colors = ['#0069a5', '#0098ee', '#7bd2f6', '#a8a8a8', '#55b5f5', '#223366'];
- var g = document.getElementById("myCanvas");
- var ctx = g.getContext("2d");
- var notchColor = 'black';
- var textColor = 'black';
- var fontFamily = 'Arial';
- var labelFontSize = 35;
- var dataFontSize = 25;
- var width = g.width;
- var height = g.height;
- var barLeft = width *.10;
- var barBottom = height * .90;
- draw();
- ctx.strokeStyle = textColor;
- ctx.lineWidth = 2;
- ctx.beginPath();
- drawGraph();
- ctx.stroke();
- function drawLine(pt1, pt2) {
- ctx.moveTo(pt1.X, pt1.Y);
- ctx.lineTo(pt2.X, pt2.Y);
- }
- function drawGraph() {
- $('#header').text('Normal Distribution of ' + size.toString() + ' values');
- ctx.font = labelFontSize.toString() + "px " + fontFamily;
- var data = "Data";
- ctx.fillText(data, width >> 1, height - labelFontSize.toString());
- //rotate ctx to draw text vertically then restore back to norm
- var freq = "Frequency";
- ctx.save();
- ctx.rotate(-Math.PI / 2);
- ctx.textAlign = "center";
- ctx.fillText(freq, -1 * (height >> 1), barLeft >> 2);
- ctx.restore();
- //draw horizontal bar
- var pt1 = new Point(barLeft, barBottom);
- var pt2 = new Point(width, barBottom);
- drawLine(pt1, pt2);
- //draw vertical bar
- var pt3 = new Point(barLeft, 0);
- var pt4 = new Point(barLeft, barBottom);
- drawLine(pt3, pt4);
- var startValue = 0;
- var partitions = density.length; //(Math.ceil((dmax - dmin) / barBottom));
- var increment = Math.ceil((dmax - dmin) / partitions);
- ctx.font = dataFontSize.toString() + "px " + fontFamily;
- ctx.fillStyle = textColor;
- //Draw vertical markers
- for (var i = startValue + increment; i <= dmax; i = i + increment) {
- var iString = i.toString(); //.substr(0, sigFig);
- var marker = barBottom * ((dmax - i) / dmax);
- ctx.fillRect(barLeft - 5, marker, 10, 3); //draw bar
- ctx.fillText(iString, barLeft - ctx.measureText(iString).width - 10, marker + (labelFontSize>>1)); //draw text
- }
- }
- function draw() {
- randomize();
- sort();
- dmax = dmax + Math.ceil((dmax - dmin) / density.length);//give some head space at top of chart
- var xPartitions = ((width - barLeft) / density.length);
- var colorSequence = 0;
- var barHeight;
- var x = barLeft;
- var y = barBottom;
- for (var i = 0; i < density.length; i++) {
- barHeight = barBottom - (barBottom * ((dmax - density[i])/dmax));
- y = barBottom - barHeight;
- //bar
- ctx.lineWidth = 1;
- ctx.fillStyle = colors[colorSequence];
- ctx.fillRect(x, y, barLeft, barHeight);
- //value text
- ctx.font = dataFontSize.toString() + "px " + fontFamily;
- ctx.fillStyle = notchColor;
- ctx.fillText(density[i].toString(), (x + x + xPartitions) >> 1, barBottom - barHeight);
- //notches
- ctx.fillStyle = notchColor;
- ctx.fillRect((x + x + xPartitions) >> 1, barBottom, 3, 10);
- //x-axis label
- ctx.font = dataFontSize.toString() + "px " + fontFamily;
- ctx.fillText(i.toString(), (x + x + xPartitions) >> 1, barBottom + 30);
- x = x + xPartitions;
- //color cycle
- if (colorSequence + 1 == colors.length) {colorSequence = 0;}else{colorSequence++;}
- }
- }
- function randomize() {
- var x1, x2, w, y1, y2;
- var count = size * .5;
- for (var i = 0; i < count; i++) {
- do {
- x1 = 2 * Math.random() - 1;
- x2 = 2 * Math.random() - 1;
- w = x1 * x1 + x2 * x2;
- } while (w >= 1);
- w = Math.sqrt((-2 * Math.log(w)) / w);
- y1 = x1 * w;
- y2 = x2 * w;
- //This technique generates two numbers at a time, might as well use both
- normalValues[i * 2] = y1;
- normalValues[(i * 2) + 1] = y2;
- }
- }
- function sort() {
- var multiplier;
- var blocks = 100;
- //find min/max values
- min = normalValues[0];
- max = normalValues[0];
- for(var i = 1; i < normalValues.length; i++){
- if(normalValues[i] < min)
- min = normalValues[i];
- if(normalValues[i] > max)
- max = normalValues[i];
- }
- //create buckets
- var buckets = (Math.round(max) - Math.round(min)) + 1;
- for (var i = 0; i <= buckets; i++) {
- density[i] = 0;
- }
- //sort into buckets
- for (var i = 0; i < normalValues.length; i++){
- //get value
- var val = Math.round(normalValues[i]);
- //find where in bucket it would be placed
- var k = 0;
- for(var j = Math.round(min); j <= Math.round(max); j++){
- if( j == val){
- density[k] = density[k] + 1;
- if(dmin > density[k])
- dmin = density[k];
- if(dmax < density[k])
- dmax = density[k];
- dcount++;
- break;
- }
- k++;
- }
- }
- }
- </script>
- </body>
- </html>

