About Me

My photo
Northglenn, Colorado, United States
I'm primarily a BI Developer on the Microsoft stack. I do sometimes touch upon other Microsoft stacks ( web development, application development, and sql server development).
Showing posts with label html5. Show all posts

Friday, February 08, 2013

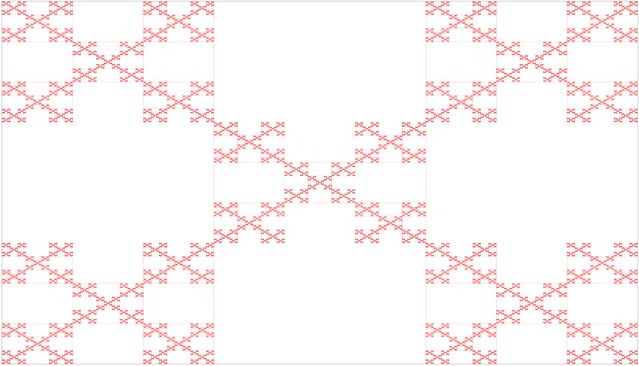
Box Fractal written in Javascript


Code Snippet
  1. <!DOCTYPE html>
  2. <html>
  3. <head>
  4.     <meta charset="utf-8" />
  5.     <meta name="viewport" content="width=device-width" />
  6.     <title>Box Fractal</title>
  7.     <link href="/Content/site.css" rel="stylesheet"/>
  8.  
  9.     <script src="/Scripts/modernizr-2.5.3.js"></script>
  10.     
  11.     <script src="/Scripts/jquery-1.7.1.js"></script>
  12.  
  13.     
  14. </head>
  15. <body>
  16.     
  17.  
  18. <h2>Box Fractal</h2>
  19.  
  20. <canvas id="myCanvas" width="1600px" height="1200px"  style="border:1px solid #d3d3d3;">
  21. Your browser does not support the HTML5 canvas tag.
  22. </canvas>
  23.  
  24. <script type="text/javascript">
  25.     function Point(X,Y) {
  26.         this.X = X;
  27.         this.Y = Y;
  28.     };
  29.  
  30.     function resizeFrame() {
  31.         var h = $(window).height();
  32.         var w = $(window).width();
  33.         $("#myCanvas").css('height', h - 100);
  34.         $("#myCanvas").css('width', w - 50);
  35.     }
  36.  
  37.     function canvas() {
  38.         this.height = $(window).height();
  39.         this.width = $(window).width();
  40.     }
  41.  
  42.     $(document).ready(function () {
  43.         jQuery.event.add(window, "load", resizeFrame);
  44.         jQuery.event.add(window, "resize", resizeFrame);
  45.  
  46.         var color = "red";
  47.         var backgroundColor = "white";
  48.         var lineWidth = 1;
  49.         var precision = 1;
  50.         var third = 0.333333;
  51.  
  52.         var g = document.getElementById("myCanvas");
  53.         var ctx = g.getContext("2d");
  54.         width = g.width;
  55.         height = g.height;
  56.         ctx.fillStyle = color;
  57.         ctx.lineWidth = lineWidth;
  58.  
  59.         //ctx.beginPath();
  60.         draw(width, height);
  61.         //ctx.stroke();
  62.  
  63.         function draw(width, height) {
  64.             //Draw initial block
  65.             var upperLeft = new Point(0, 0);
  66.             ctx.fillRect(upperLeft.X, upperLeft.Y, width, height);
  67.  
  68.             ctx.fillStyle = backgroundColor;
  69.             drawBox(upperLeft, width, height);
  70.         }
  71.  
  72.         function drawBox(upperLeft, width, height) {
  73.             if (width * third > precision) {
  74.                 var top = new Point(upperLeft.X + width * third, upperLeft.Y);
  75.                 var left = new Point(upperLeft.X, upperLeft.Y + height * third);
  76.                 var right = new Point(upperLeft.X + 2 * width * third, upperLeft.Y + height * third);
  77.                 var bottom = new Point(upperLeft.X + width * third, upperLeft.Y + 2 * height * third);
  78.  
  79.                 //Remove 4 squares
  80.                 ctx.fillRect(top.X, top.Y, width * third, height * third);
  81.                 ctx.fillRect(left.X, left.Y, width * third, height * third);
  82.                 ctx.fillRect(right.X, right.Y, width * third, height * third);
  83.                 ctx.fillRect(bottom.X, bottom.Y, width * third, height * third);
  84.  
  85.  
  86.                 //upperleft box
  87.                 drawBox(upperLeft, width * third, height * third);
  88.                 //upperright box
  89.                 drawBox(new Point(upperLeft.X + 2 * width * third, upperLeft.Y), width * third, height * third);
  90.                 //middle box
  91.                 drawBox(new Point(upperLeft.X + width * third, upperLeft.Y + height * third), width * third, height * third);
  92.                 //lowerleft box
  93.                 drawBox(new Point(upperLeft.X, upperLeft.Y + 2 * height * third), width * third, height * third);
  94.                 //lowerright box
  95.                 drawBox(new Point(upperLeft.X + 2 * width * third, upperLeft.Y + 2 * height * third), width * third, height * third);
  96.  
  97.             }
  98.         }
  99.     });
  100.  
  101. </script>
  102. </body>
  103. </html>

Friday, February 01, 2013

Sierpinski's Triangle written in Javascript


Code Snippet
  1. <!DOCTYPE html>
  2. <html>
  3. <head>
  4.     <meta charset="utf-8" />
  5.     <meta name="viewport" content="width=device-width" />
  6.     <title>Sierpinski Triangle</title>
  7.     <link href="/Content/site.css" rel="stylesheet"/>
  8.  
  9.     <script src="/Scripts/modernizr-2.5.3.js"></script>
  10.     
  11.     <script src="/Scripts/jquery-1.7.1.js"></script>
  12.  
  13.     
  14. </head>
  15. <body>
  16.     
  17. <h2>Sierpinski Triangle</h2>
  18. <canvas id="myCanvas" width="1600px" height="1200px"  style="border:1px solid #d3d3d3;">
  19. Your browser does not support the HTML5 canvas tag.
  20. </canvas>
  21.  
  22. <script type="text/javascript">
  23.  
  24.     function Point(X,Y) {
  25.         this.X = X;
  26.         this.Y = Y;
  27.     };
  28.  
  29.     function resizeFrame() {
  30.         var h = $(window).height();
  31.         var w = $(window).width();
  32.         $("#myCanvas").css('height', h - 100);
  33.         $("#myCanvas").css('width', w - 50);
  34.     }
  35.  
  36.     function canvas() {
  37.         this.height = $(window).height();
  38.         this.width = $(window).width();
  39.     }
  40.  
  41.     $(document).ready(function () {
  42.         jQuery.event.add(window, "load", resizeFrame);
  43.         jQuery.event.add(window, "resize", resizeFrame);
  44.  
  45.         var color = "red";
  46.         var backgroundColor = "white";
  47.         var lineWidth = 1;
  48.         var precision = 1; //30,10,8
  49.         //var canvasDim = new canvas();
  50.  
  51.         var g = document.getElementById("myCanvas");
  52.         var ctx = g.getContext("2d");
  53.         width = g.width;
  54.         height = g.height;
  55.         ctx.fillStyle = backgroundColor;
  56.         ctx.fillRect(0, 0, width, height);
  57.         ctx.strokeStyle = color;
  58.         ctx.lineWidth = lineWidth;
  59.  
  60.         ctx.beginPath();
  61.         draw(width, height);
  62.         ctx.stroke();
  63.  
  64.  
  65.         function drawLine(pt1, pt2) {
  66.             ctx.moveTo(pt1.X, pt1.Y);
  67.             ctx.lineTo(pt2.X, pt2.Y);
  68.             //requestAnimationFrame(render);
  69.         }
  70.  
  71.         function draw(width, height) {
  72.             //Draw initial outer triangle
  73.             var top = new Point(width >> 1, 0);
  74.             var bottomLeft = new Point(0, height);
  75.             var bottomRight = new Point(width, height);
  76.  
  77.             drawLine(top, bottomLeft);
  78.             drawLine(bottomLeft, bottomRight);
  79.             drawLine(bottomRight, top);
  80.  
  81.             drawSierp(top, bottomLeft, bottomRight);
  82.         }
  83.  
  84.         function drawSierp(a, b, c) {
  85.             if ((a.X - b.X) > precision) {
  86.                 drawLine(a, b);
  87.                 drawLine(b, c);
  88.                 drawLine(c, a);
  89.                 drawLine(a, new Point((a.X + b.X) >> 1, (a.Y + b.Y) >> 1));
  90.                 drawLine(b, new Point((a.X + b.X) >> 1, (a.Y + b.Y) >> 1));
  91.                 drawLine(c, new Point((b.X + c.X) >> 1, (b.Y + c.Y) >> 1));
  92.                 drawLine(a, new Point((c.X + a.X) >> 1, (c.Y + a.Y) >> 1));
  93.                 drawLine(b, new Point((b.X + c.X) >> 1, (b.Y + c.Y) >> 1));
  94.                 drawLine(c, new Point((c.X + a.X) >> 1, (c.Y + a.Y) >> 1));
  95.  
  96.                 drawSierp(a, new Point((a.X + b.X) >> 1, (a.Y + b.Y) >> 1), new Point((c.X + a.X) >> 1, (c.Y + a.Y) >> 1));
  97.                 drawSierp(new Point((a.X + b.X) >> 1, (a.Y + b.Y) >> 1), b, new Point((b.X + c.X) >> 1, (b.Y + c.Y) >> 1));
  98.                 drawSierp(new Point((c.X + a.X) >> 1, (c.Y + a.Y) >> 1), new Point((b.X + c.X) >> 1, (b.Y + c.Y) >> 1), c);
  99.             }
  100.         }
  101.  
  102.     });
  103. </script>
  104. </body>
  105. </html>

Thursday, January 31, 2013

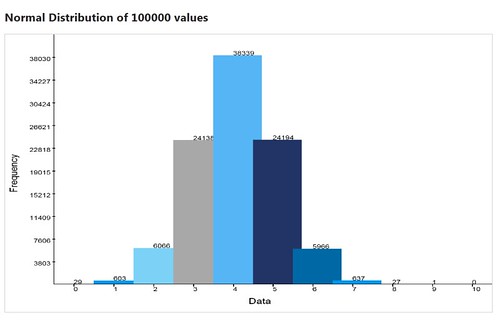
Graph written in javascript of a Normal Distribution Random Number Gen.


Code Snippet
  1. <!DOCTYPE html>
  2. <html>
  3. <head>
  4.     <meta charset="utf-8" />
  5.     <meta name="viewport" content="width=device-width" />
  6.     <title>Normal Distribution</title>
  7.     <link href="/Content/site.css" rel="stylesheet"/>
  8.  
  9.     <script src="/Scripts/modernizr-2.5.3.js"></script>
  10.  
  11.     <script src="/Scripts/jquery-1.7.1.js"></script>
  12.  
  13.     
  14. </head>
  15. <body>
  16.     
  17.  
  18. <h2 id="header" class="header">Normal Distribution</h2>
  19.  
  20. <canvas id="myCanvas" width="1600px" height="1200px" style="border: 1px solid #d3d3d3;">Your browser does not support the HTML5 canvas tag.
  21. </canvas>
  22.  
  23. <script type="text/javascript">
  24.     function Point(X, Y) {this.X = X;this.Y = Y;};
  25.     function resizeFrame() {var h = $(window).height();var w = $(window).width();$("#myCanvas").css('height', h - 100); $("#myCanvas").css('width', w - 50);}
  26.     function canvas() {this.height = $(window).height();this.width = $(window).width();}
  27.  
  28.     $(document).ready(function () {
  29.         jQuery.event.add(window, "load", resizeFrame);
  30.         jQuery.event.add(window, "resize", resizeFrame);
  31.     });
  32.  
  33.     var min,max,headSpace;
  34.     var size = 100000;
  35.     var density = [];
  36.     var dcount = 0;
  37.     var normalValues = [];
  38.     var dmin = 9007199254740992;
  39.     var dmax = 0;
  40.     var colors = ['#0069a5', '#0098ee', '#7bd2f6', '#a8a8a8', '#55b5f5', '#223366'];
  41.     var g = document.getElementById("myCanvas");
  42.     var ctx = g.getContext("2d");
  43.     var notchColor = 'black';
  44.     var textColor = 'black';
  45.     var fontFamily = 'Arial';
  46.     var labelFontSize = 35;
  47.     var dataFontSize = 25;
  48.     var width = g.width;
  49.     var height = g.height;
  50.     var barLeft = width *.10;
  51.     var barBottom = height * .90;
  52.  
  53.     draw();
  54.  
  55.     ctx.strokeStyle = textColor;
  56.     ctx.lineWidth = 2;
  57.     ctx.beginPath();
  58.     drawGraph();
  59.     ctx.stroke();
  60.  
  61.     function drawLine(pt1, pt2) {
  62.         ctx.moveTo(pt1.X, pt1.Y);
  63.         ctx.lineTo(pt2.X, pt2.Y);
  64.     }
  65.  
  66.     function drawGraph() {
  67.         $('#header').text('Normal Distribution of ' + size.toString() + ' values');
  68.         ctx.font = labelFontSize.toString() + "px " + fontFamily;
  69.         var data = "Data";
  70.         ctx.fillText(data, width >> 1, height - labelFontSize.toString());
  71.  
  72.         //rotate ctx to draw text vertically then restore back to norm
  73.         var freq = "Frequency";
  74.         ctx.save();
  75.         ctx.rotate(-Math.PI / 2);
  76.         ctx.textAlign = "center";
  77.         ctx.fillText(freq, -1 * (height >> 1), barLeft >> 2);
  78.         ctx.restore();
  79.  
  80.         //draw horizontal bar   
  81.         var pt1 = new Point(barLeft, barBottom);
  82.         var pt2 = new Point(width, barBottom);
  83.         drawLine(pt1, pt2);
  84.  
  85.         //draw vertical bar
  86.         var pt3 = new Point(barLeft, 0);
  87.         var pt4 = new Point(barLeft, barBottom);
  88.         drawLine(pt3, pt4);
  89.  
  90.         var startValue = 0;
  91.         var partitions = density.length;  //(Math.ceil((dmax - dmin) / barBottom));
  92.         var increment = Math.ceil((dmax - dmin) / partitions);
  93.  
  94.         ctx.font = dataFontSize.toString() + "px " + fontFamily;
  95.         ctx.fillStyle = textColor;
  96.         //Draw vertical markers
  97.         for (var i = startValue + increment; i <= dmax; i = i + increment) {
  98.             var iString = i.toString(); //.substr(0, sigFig);
  99.             var marker = barBottom * ((dmax - i) / dmax);
  100.             ctx.fillRect(barLeft - 5, marker, 10, 3); //draw bar
  101.             ctx.fillText(iString, barLeft - ctx.measureText(iString).width - 10, marker + (labelFontSize>>1)); //draw text
  102.         }
  103.     }
  104.  
  105.     function draw() {
  106.         randomize();
  107.         sort();
  108.  
  109.         dmax = dmax +  Math.ceil((dmax - dmin) / density.length);//give some head space at top of chart
  110.  
  111.         var xPartitions = ((width - barLeft) / density.length);
  112.         var colorSequence = 0;
  113.         var barHeight;
  114.         var x = barLeft;
  115.         var y = barBottom;
  116.  
  117.         for (var i = 0; i < density.length; i++) {
  118.             barHeight = barBottom - (barBottom * ((dmax - density[i])/dmax));
  119.             y = barBottom - barHeight;
  120.  
  121.             //bar
  122.             ctx.lineWidth = 1;
  123.             ctx.fillStyle = colors[colorSequence];
  124.             ctx.fillRect(x, y, barLeft, barHeight);
  125.  
  126.             //value text
  127.             ctx.font = dataFontSize.toString() + "px " + fontFamily;
  128.             ctx.fillStyle = notchColor;
  129.             ctx.fillText(density[i].toString(), (x + x + xPartitions) >> 1, barBottom - barHeight);
  130.  
  131.             //notches
  132.             ctx.fillStyle = notchColor;
  133.             ctx.fillRect((x + x + xPartitions) >> 1, barBottom, 3, 10);
  134.  
  135.             //x-axis label
  136.             ctx.font = dataFontSize.toString() + "px " + fontFamily;
  137.             ctx.fillText(i.toString(), (x + x + xPartitions) >> 1, barBottom + 30);
  138.  
  139.             x = x + xPartitions;
  140.  
  141.             //color cycle
  142.             if (colorSequence + 1 == colors.length) {colorSequence = 0;}else{colorSequence++;}
  143.         }
  144.     }
  145.  
  146.     function randomize() {
  147.         var x1, x2, w, y1, y2;
  148.         var count = size * .5;
  149.  
  150.         for (var i = 0; i < count; i++) {
  151.             do {
  152.                 x1 = 2 * Math.random() - 1;
  153.                 x2 = 2 * Math.random() - 1;
  154.                 w = x1 * x1 + x2 * x2;
  155.             } while (w >= 1);
  156.  
  157.             w = Math.sqrt((-2 * Math.log(w)) / w);
  158.             y1 = x1 * w;
  159.             y2 = x2 * w;
  160.  
  161.             //This technique generates two numbers at a time, might as well use both
  162.             normalValues[i * 2] = y1;
  163.             normalValues[(i * 2) + 1] = y2;
  164.         }
  165.     }
  166.  
  167.     function sort() {
  168.         var multiplier;
  169.         var blocks = 100;
  170.  
  171.         //find min/max values
  172.         min = normalValues[0];
  173.         max = normalValues[0];
  174.  
  175.         for(var i = 1; i <  normalValues.length; i++){
  176.             if(normalValues[i] < min)
  177.                 min = normalValues[i];
  178.  
  179.             if(normalValues[i] > max)
  180.                 max = normalValues[i];
  181.         }
  182.  
  183.         //create buckets
  184.         var buckets = (Math.round(max) - Math.round(min)) + 1;
  185.         for (var i = 0;  i <= buckets; i++) {
  186.             density[i] = 0;
  187.         }
  188.  
  189.         //sort into buckets
  190.         for (var i = 0; i < normalValues.length; i++){
  191.             //get value
  192.             var val = Math.round(normalValues[i]);
  193.             //find where in bucket it would be placed
  194.             var k = 0;
  195.             
  196.             for(var j = Math.round(min); j <= Math.round(max); j++){
  197.                 if( j == val){
  198.                     density[k] = density[k] + 1;
  199.                     if(dmin > density[k])
  200.                         dmin = density[k];
  201.                     if(dmax < density[k])
  202.                         dmax = density[k];
  203.                     dcount++;
  204.                     break;
  205.                 }
  206.                 k++;
  207.             }
  208.         }  
  209.     }
  210. </script>
  211.  
  212.  
  213. </body>
  214. </html>

Wednesday, January 30, 2013

Quick Note: Resize canvas to browser

Resize canvas to browser's width/height (at least in IE9+), using jQuery:

Code Snippet
  1. <canvas id="myCanvas" width="1600px" height="1200px" style="border: 1px solid #d3d3d3;">Your browser does not support the HTML5 canvas tag.
  2. </canvas>
  3.  
  4. <script type="text/javascript">
  5.     function resizeFrame() {var h = $(window).height();var w = $(window).width();$("#myCanvas").css('height', h - 100); $("#myCanvas").css('width', w - 50);}
  6.  
  7.     $(document).ready(function () {
  8.         jQuery.event.add(window, "load", resizeFrame);
  9.         jQuery.event.add(window, "resize", resizeFrame);
  10.     });
  11.  
  12.     
  13. </script>